
It is the third working day of the month, and finance asks what your support agent costs per completed ticket. FinOps for AI agents is the practice of pricing every model and tool call against the task that caused it, and reconciling those task-level costs with the provider's bill. The cloud billing export can tell you the project, the model, the SKU and the day. It cannot name a single ticket, because it was never built to.
The bill is authoritative but late and coarse; the decisions you need to make are per task and need answers within minutes. So you run two ledgers: the bill the provider sends, and a meter you build yourself that prices every model and tool call against the task that caused it. Then you reconcile the two every day.
The bill tells you which team spent the money. Only your own meter can tell you which task it bought.
If you read only this:
- Price the outcome. Track cost per completed task, with failed attempts and retries counted in the cost but not in the successes.
- Labels for the bill, metadata for the meter. Billing labels and tags must stay low-cardinality; task and session IDs belong in your own records.
- Alerts notify; limits and caps are not instant. Budget alerts stop nothing. Where providers document their spend limits and cloud spend caps, enforcement is not instantaneous, and Google Cloud bills any overage. Only a check in your own agent loop acts before the next call.
Why agent spend strains the usual FinOps loop
The FinOps Foundation's FinOps Framework works in three phases that practitioners cycle through: Inform (examine cost, usage and efficiency data), Optimize (find ways to improve efficiency and value) and Operate (put those changes into effect). Two of its six principles matter most here: "Everyone takes ownership for their technology usage" and "FinOps data should be accessible, timely, and accurate".
Agents test both principles. One user request becomes a run of model calls and tool calls, and the length of that run changes from task to task. The Foundation's own guidance on AI names the consequences. AI cost and usage is "very granular". "The likelihood of anomalous spending will increase as teams experiment." Forecast predictability is "generally lower". And there is a "Lack of generally accepted frameworks for cost allocation across multi-agent workloads."
Its working group's paper GenAI FinOps: How Token Pricing Really Works puts the central point in one line: "the cost per unit is not a fixed price. It is a distribution." Think of a corporate card. The bank's statement is the record of truth, but it lists merchants and dates, not the trip or the customer. Your receipts say what each charge was for. A finance team needs both, and it needs them to agree.
Two ledgers: the bill and the meter
The billing ledger is the provider's record: the usage and cost endpoints of the Anthropic and OpenAI admin APIs, the Cloud Billing export to BigQuery on Google Cloud, Cost and Usage Reports on AWS, and Cost Management exports on Azure. It is what you pay. On Google Cloud, Agent Platform's labels documentation says labelled model costs are "typically" available within a day.
The metering ledger is yours. At each model call, a shared client or gateway reads the token counts from the response and writes one record carrying the task ID, the agent, the tenant and the step. A downstream job prices those records against your rate card and adds paid tool calls. AWS documents this exact pattern in its Amazon Bedrock guide to per-request metadata tagging and is plain about its limits: it is "per-prompt and near real-time, but it is an estimate", and it ignores discounts, commitments, batch pricing and provisioned throughput unless you model them.

| Ledger | Grain | Speed | Accuracy | Answers |
|---|---|---|---|---|
| Billing ledger | Project, label or tag, SKU, day | Hours to a day | Authoritative | What did we pay, and which team or project paid it? |
| Metering ledger | Task, step, agent, tenant | At the call | Estimate from your rate card | What did this task cost, and was it worth it? |
The two meet at the grain they share. AWS says neither classic CUR nor CUR 2.0 carries a per-request identifier, so its best practices for cost attribution recommend reconciling log-derived costs against CUR "at the model and usage-type grain". Do the same on every platform: each day, total your meter by model and compare it with the billed amount for that model. A gap that grows usually means a rate card that has drifted, a discount you have not modelled, or traffic that bypasses the gateway.
Unit economics: price the completed ticket, not the token
The Foundation's unit economics guidance says early generative AI work "often starts with cost per token" and moves toward outcome measures such as "cost per case deflected". For a support agent, a completed task is a ticket the agent resolves without handing it to a person. Cost per completed task counts failed attempts and retries in the cost, but not in the successes. Its working group states the rule that makes the number honest: "Compare models on cost per successful outcome, not cost per token."
Here is a deliberately simplified model of that agent. Every rate is a hypothetical round number, not any vendor's price. The formulas follow the tables, and a script you can run follows the formulas.
| Assumption | Simple ticket | Standard ticket | Hard ticket |
|---|---|---|---|
| Share of 30,000 tickets a month | 60% | 30% | 10% |
| Model calls per attempt | 4 | 10 | 30 |
| Average input / output tokens per call | 6,000 / 400 | 12,000 / 600 | 30,000 / 800 |
| Paid tool calls per attempt | 1 | 4 | 12 |
| Share resolved without a person | 95% | 80% | 40% |
The hypothetical rates in this model are $1.00 per million input tokens, $5.00 per million output tokens, and $0.002 per paid tool call.
Three formulas produce every number below.
- Cost per attempt = calls × (input tokens × input rate + output tokens × output rate) + paid tool calls × tool rate
- Monthly spend = the sum, over the three ticket kinds, of tickets × share × cost per attempt
- Cost per completed ticket = monthly spend ÷ the sum of tickets × share × share resolved
Worked for a hard ticket: 30 × (30,000 × $1.00 ÷ 1,000,000 + 800 × $5.00 ÷ 1,000,000) + 12 × $0.002 = 30 × $0.034 + $0.024 = $1.044 per attempt. With 40% resolved, that is $1.044 ÷ 0.40 = $2.61 per completed hard ticket.
Before reading on, guess what share of the month's spend the hard tenth of tickets takes.
| Result | Simple | Standard | Hard | All tickets |
|---|---|---|---|---|
| Cost per attempt | $0.034 | $0.158 | $1.044 | $0.172 |
| Share of tickets | 60% | 30% | 10% | 100% |
| Share of spend | 11.8% | 27.5% | 60.6% | 100% |
| Cost per completed ticket | $0.036 | $0.198 | $2.61 | $0.203 |
In the simplified model, total spend on the support agent is $5,166 a month. In this model, the hardest tenth of tickets takes about 61% of the monthly spend, and each hard ticket the agent does resolve costs $2.61. The blended cost per completed ticket in this model is $0.203, about 18% above the cost per attempt, because the 15% of tickets that are escalated still cost money. The cost of the person who handles an escalated ticket is outside this model.
To check the arithmetic, run this with Python 3. Its output gives every figure in the results table and the paragraphs after it.
# Hypothetical rates in USD, not any vendor's price list.
IN, OUT, TOOL = 1.00 / 1e6, 5.00 / 1e6, 0.002  # per input token, output token, paid tool call
TICKETS = 30_000                                # tickets attempted per month
# kind: (share of tickets, calls, input tokens/call, output tokens/call, tool calls, share resolved)
MIX = {"simple": (0.60, 4, 6_000, 400, 1, 0.95),
       "standard": (0.30, 10, 12_000, 600, 4, 0.80),
       "hard": (0.10, 30, 30_000, 800, 12, 0.40)}

def month(mix):
    rows, spend, done = [], 0.0, 0.0
    for kind, (share, calls, tin, tout, tools, ok) in mix.items():
        attempt = calls * (tin * IN + tout * OUT) + tools * TOOL   # cost per attempt
        n = TICKETS * share
        rows.append((kind, attempt, n * attempt, attempt / ok))    # attempt / ok = per completed
        spend, done = spend + n * attempt, done + n * ok
    for kind, attempt, cost, per_done in rows:
        print(f"{kind}: attempt ${attempt:.4f}, share of spend {cost / spend:.1%}, "
              f"per completed ${per_done:.4f}")
    print(f"spend ${spend:,.0f}; per attempted ${spend / TICKETS:.4f}; "
          f"completed {done:,.0f} ({done / TICKETS:.1%}); per completed ${spend / done:.4f}")
    return spend, done

s0, d0 = month(MIX)
s1, d1 = month({**MIX, "simple": (0.55,) + MIX["simple"][1:], "hard": (0.15,) + MIX["hard"][1:]})
print(f"mix 60/30/10 -> 55/30/15: spend {s1 / s0 - 1:+.1%}, per completed "
      f"${s0 / d0:.3f} -> ${s1 / d1:.3f} ({(s1 / d1) / (s0 / d0) - 1:+.1%})")
print(f"per completed vs per attempted: {(s0 / d0) / (s0 / TICKETS) - 1:+.1%}")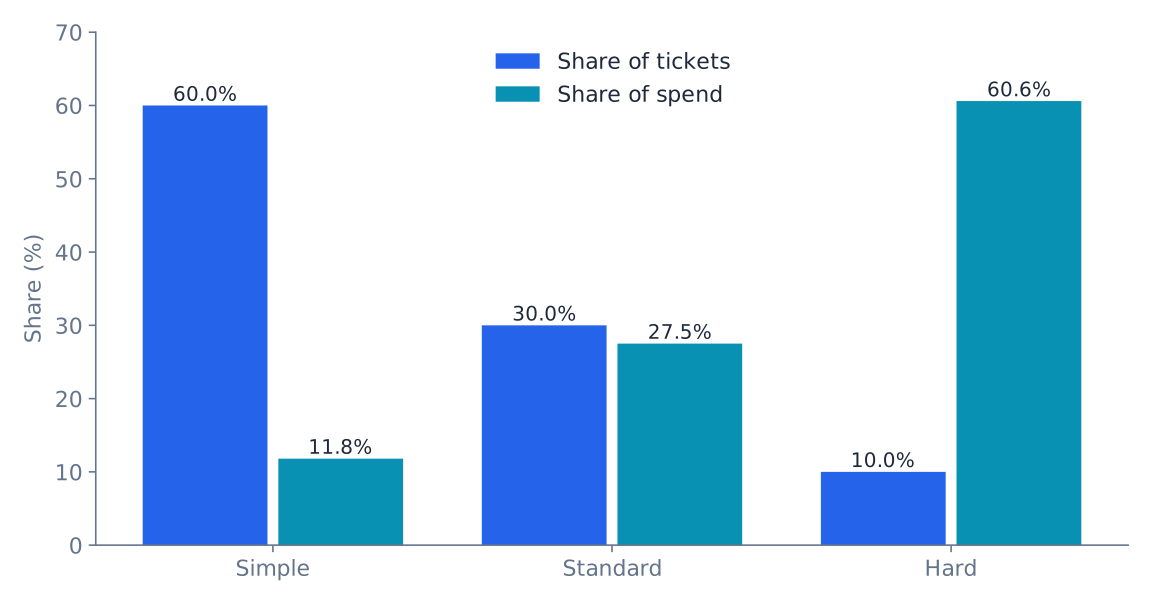
The lesson carries over to your own numbers. The FinOps conversation about an agent is mostly about its hard tail and its resolution rate, so cost belongs on the same dashboard as quality. A cheaper model that lowers the resolution rate can raise the cost per completed ticket.
Cost attribution: labels for the bill, metadata for the meter
Attribution answers "who spent this?" Most teams try to do it all with billing labels and find out the limits the hard way. The rule that resolves it is cardinality: billing labels hold a few stable values, and anything unique per task lives in your meter.
Google Cloud, in detail. On Gemini Enterprise Agent Platform (Google describes it as an evolution of Vertex AI), generateContent and streamGenerateContent accept custom metadata labels, and the labels reach Cloud Billing, so you can group billed charges by them. Up to 64 labels are allowed per call for Google models and up to 32 for partner models such as Anthropic's (sent in a header). Two details decide the design. First, "Each label key can have up to 1000 unique values across all requests over the life of the associated billing account", so a ticket ID in a label would exhaust that limit. Second, labels reach Cloud Billing only for pay-as-you-go requests; "Requests using the Provisioned Throughput consumption option will silently ignore labels."
from google import genai
from google.genai import types

client = genai.Client(enterprise=True, project="your-project", location="global")
MODEL = "your-model-id"  # placeholder; current example: gemini-3.8-flash

def run_step(prompt: str, ticket_id: str, step: int):
    resp = client.models.generate_content(
        model=MODEL,
        contents=prompt,
        # Low-cardinality labels: these reach the Cloud Billing export.
        config=types.GenerateContentConfig(
            labels={"team": "support", "agent": "triage", "env": "prod"}),
    )
    u = resp.usage_metadata
    # Tokens only; a downstream job prices them against your rate card.
    write_meter_record({  # your store; high-cardinality IDs live here
        "ticket_id": ticket_id, "step": step, "model": MODEL,
        "traffic_type": str(u.traffic_type),
        "input": u.prompt_token_count,  # includes the cached tokens below
        "cached": u.cached_content_token_count,
        "output": u.candidates_token_count, "thoughts": u.thoughts_token_count,
        "tool_input": u.tool_use_prompt_token_count,
    })
    return resp
The record keeps traffic_type because labels are dropped for provisioned throughput, and keeps thinking tokens separately because they are generally priced like output tokens where they are metered separately. In that SDK, the prompt count includes cached tokens, so price the cached share at the cached rate rather than adding it twice; tool-result tokens are counted separately. Field names were checked against google-genai 2.33.0.
The same split exists on every platform, under different names:
| Platform | Allocation on the bill | Per-call detail for your meter |
|---|---|---|
| Google Cloud | Projects, plus request labels (low-cardinality) | Token counts in usage_metadata |
| AWS (Amazon Bedrock) | IAM principal attribution, application inference profiles, projects and workspaces, as cost allocation tags | requestMetadata on Converse (16 entries), written to invocation logs only if logging is on in that Region; never to CUR |
| Microsoft Foundry | An automatic project tag on usage (Preview, models sold by Azure), plus deployment tags, per its guide to planning and managing costs | Not documented per request; use token counts from responses |
| Anthropic | Workspaces and API keys in the Usage and Cost Analytics API (beta; it replaces the legacy Usage and Cost API) | usage on each response |
| OpenAI | Projects in the Usage and Costs endpoints of the Admin API, shown in its Usage API and Cost API cookbook | usage on each response |
Four operational details catch teams out. AWS cost allocation tags appear only after you activate them and can take up to 24 hours to show; a cost allocation tag backfill can reapply them for up to twelve months, but only where the tag was on the resource at the time. AWS also notes that per-call tagging is opt-in and Bedrock does not reject untagged calls, so set tags in one shared client or gateway rather than in every team's code. If Bedrock invocation logging is off in a Region, calls still succeed but their metadata is not kept. And the FOCUS project lists AWS, Microsoft and Google Cloud among the providers of FOCUS datasets, but neither Anthropic nor OpenAI, so you normalise their data yourself.
Reconciling the bill with the ledger
The bill and the meter measure the same spend from two ends, so they should differ by a list of known items and nothing else. Write the reconciliation as an equation and make the daily job compute each term:
Provider invoice = sum of the per-task ledger + unattributed spend
Unattributed spend is everything on the bill that no task record explains. The usual terms are these.
| Term | Why it is missing from the ledger | How to close it |
|---|---|---|
| Calls without a task ID | Evaluation runs, background jobs, retries or tools that bypass the gateway | Give them a pseudo-task such as eval or unattributed, and alert when its share grows |
| Idle and base charges | Provisioned throughput, commitments and subscriptions bill whether or not a task ran | Allocate them to tasks by metered share, using the rule written for shared costs below |
| Credits and discounts | Your rate card prices at list; the bill nets them off | Model them as a negative term, or apply an effective discount rate per model |
| Tax, refunds and late adjustments | They are bill lines, not calls | Reconcile before tax, and re-run recent days when the provider restates |
| Rounding and rate drift | Floating-point sums; a rate card that no longer matches | Sum in exact units; refresh the rate card when a price or model changes |
What each provider documents shows why the terms exist. Google Cloud's standard usage cost table defines cost as the cost "inclusive of any negotiated discounts", and its example query adds the summed credits to the summed cost to get the total. It also warns that summing total "can result in floating point rounding errors" and offers total_exact, which sums in micros. AWS's Cost and Usage Report line item types include Usage, Discount, Credit, Refund, Tax and Fee, and AWS says it might update reports after they have been finalized when a credit or refund is applied for the month. Anthropic's Usage and Cost Analytics API (beta) shows Priority Tier requests with zero token cost, because the commitment is billed separately, reports the default workspace under its real ID, and revises values until about seven days after month end. Its legacy Usage and Cost API, still supported, leaves Priority Tier out of the cost endpoint and gives the default workspace a null workspace ID. OpenAI's Costs endpoint returns dollar amounts in daily buckets that you can group by project or line item, and its usage endpoint returns token and request counts, so the two need joining before you compare them.
To close a gap, work from the coarse grain to the fine one:
- Pick a day and a model, and compute gap = billed amount - metered amount, using the same time zone and the same pre-tax basis on both sides.
- Subtract the known terms in the table: credits, discounts, tax and base charges.
- If a residual remains, split the day's calls by whether they carry a task ID. A large unlabelled share points to traffic that bypasses the gateway.
- If the labelled calls still do not match, compare token counts with the provider's usage export for the same bucket. A token mismatch means missing records; a price mismatch means a stale rate card.
- Record the residual as its own line. A small, stable residual is a result. A growing one is the alert.
Budgets, alerts and spend caps: what each one actually stops
A budget is easy to mistake for a limit. Back to the corporate card: a statement alert is not a declined card. The controls fall into four kinds, and they differ in what they stop and how soon.

| Platform | Alert | Hard stop | What the docs say about timing |
|---|---|---|---|
| Anthropic | Workspace spend alerts at thresholds | Workspace spend limits "cap monthly spending" (not on the Default Workspace) | Analytics data "typically refreshes within 4 hours" and can take up to 24 (the legacy API: "within 5 minutes"); enforcement timing is not documented |
| OpenAI | Spend alerts, which "do not enforce a cap" | Organisation and project hard limits return a 429 with organization_spend_limit_exceeded or project_spend_limit_exceeded | "Enforcement is not instantaneous" |
| Google Cloud | Budgets with actual and forecasted thresholds; Pub/Sub for automation | Spend cap budget for one project and one eligible service, including Gemini API and Agent Platform | Caps use gross, estimated costs, before savings and credits; enforcement "isn't instant and any cost overages are billed as normal" |
| AWS | AWS Budgets, actual and forecasted | Budget actions apply an IAM policy or SCP you write, automatically or after approval | Budget data is "updated up to three times a day" |
| Azure | Cost Management budgets; action groups for automation | None for Azure OpenAI; Microsoft says automation from action groups "requires additional custom development" | Cost data is typically available within 8 to 24 hours; budgets are evaluated every 24 hours |
Four design decisions follow.
- Put the first stop in your own code. A per-task budget checked before each model or tool call is the only control that acts before the money is spent. How the loop stops, retries or escalates is loop design, which is beyond the scope of this piece.
- Give an agent its own project if it needs a hard stop. Google Cloud spend caps apply to a single project and a single service; labels, folders and multi-project budgets are out of scope. A cap on a shared project pauses every agent in it that uses that service.
- Cap sandboxes, not customers. A spend cap pauses the service for the rest of the budget period until someone lifts it. That suits development and evaluation projects. For a customer-facing agent, prefer forecasted alerts routed to on-call, plus gateway quotas such as the token limits that AI Gateway in Microsoft Foundry provides through Azure API Management.
- Alert on the forecast, not only the actual. Google Cloud, AWS and Azure all support forecasted thresholds, and with day-scale data lag a forecast alert is often the earliest warning you get.
Showback first, chargeback when finance asks
The Foundation's invoicing and chargeback guidance is direct: "Showback is always required in any FinOps practice, but chargeback is dependent on organizational accounting policies." Start with showback. Show each team its agents' cost per completed task, and let the numbers change behaviour before anyone moves money between budgets.
Shared costs need an allocation rule written down before the first dispute. Two rules work for agents. Split shared platform costs, such as the gateway, vector store and evaluation runs, in proportion to each team's metered spend. When one agent calls another team's agent, charge the work to the task that started the chain, using the root of the trace. The Foundation notes there is no generally accepted framework for this yet, so choose one rule and apply it consistently.
Forecasting agent spend: volume, mix and rate card
A forecast built on ticket volume alone misses the variable that moves most. In the simplified model, shifting the mix from 60/30/10 to 55/30/15 at the same volume raises monthly spend by 29.3% and cost per completed ticket by 33.7%, from $0.203 to $0.271. Nothing about the model or the price changed; the tickets got harder.
So forecast three things separately: task volume, task mix and the rate card. Rate cards move when you change model, when a model version is retired, or when discounts such as caching and batch pricing apply to more of your traffic. The Foundation's AI guidance advises that AI forecasts need "more frequent revision"; a monthly re-forecast that uses the last month's metered mix is a reasonable starting cadence. Count development and evaluation traffic too, since it is billed like any other.
Honest limits
- The meter is an estimate. It is only as current as your rate card, and it misses discounts, commitments and provisioned throughput unless you model them. The bill is the authority; the meter explains it.
- Caps are blunt and late. Google Cloud caps act on gross, estimated costs and bill the overage; OpenAI says recorded spend can slightly exceed a hard limit; Anthropic does not document enforcement timing. None is a substitute for a per-task check.
- Normalisation is still your job. The FOCUS specification, now at version 1.4, normalises cloud bills, but per-token data from model providers does not arrive in one shape.
- Multi-agent allocation is unsettled. The trace-root rule above is a workable convention, not a standard.
- The model is a model. Your mix, token counts and resolution rates will differ, and it ignores human handling cost, which often outweighs the model cost on escalated tickets.
Takeaways
- Cost per completed task is the unit. Track it next to the resolution rate, never apart from it.
- Run two ledgers and reconcile them daily by model and day.
- Keep billing labels low-cardinality. Agent Platform request labels allow 1,000 unique values per key over the life of a billing account.
- Know what each control stops. An alert notifies; a cap enforces late on estimated spend; your own loop acts first.
- Forecast volume, mix and rate card separately. In the simplified model, a five-point shift in mix moved spend by 29%.
Reread-me checklist
- Every model call goes through one client or gateway that writes a metering record.
- Billing labels or tags cover team, agent and environment only, and they are activated where the platform requires it.
- A daily job compares metered cost with billed cost by model and day, and alerts on a growing gap.
- Each agent has a cost per completed task on the same dashboard as its resolution rate.
- Development and evaluation run in their own projects or workspaces, with spend caps or hard limits.
- Production agents have forecasted alerts routed to a person who can act.
- The shared-cost allocation rule is written down, and finance has agreed to it.
What's next
In AELSHA™ ASTRA, the framework behind our engagements, cost is a release gate: the Harden phase closes only with a security and FinOps sign-off, and every trace that breaches a cost threshold is kept in full rather than sampled away. The AELSHA™ ASTRA page describes the lifecycle, and the post on AI agent autonomy tiers covers the approvals that sit beside cost controls.
One request: work out your agent's cost per completed task and the share of spend taken by its hardest tenth of tasks, then tell us whether your split looks like the model's.
Further reading
- FinOps for AI Overview, FinOps Foundation: The working group's map of what changes when AI enters a FinOps practice, from showback to tagging gaps.
- GenAI FinOps: How Token Pricing Really Works, FinOps Foundation: Why the cost of a unit of AI work is a distribution, and why you price the successful outcome.
- Best practices for cost attribution, AWS: The most concrete vendor write-up of the two-ledger pattern, down to reconciling against CUR.
- Manage spend cap budgets, Google Cloud: Read it before you rely on any cap, for its scope limits and its plain words on timing and overage.
- Estimate and cap LLM costs before an AI agent runs, AELSHA™ NEHEMVIX: A low, likely and high cost range before anything is spent, and a spending cap enforced with ledger reservations.
Billing features, spend controls and preview labels change often, so check each provider's own documentation before you design controls around them.